作ったファイルは一つ(matplotlib.hpp)です。
#ifndef MATPLOTLIB_HPP
#define MATPLOTLIB_HPP

#include <cstdio>

class matplotlib {
	FILE *p;

	public:

	bool open() {
		p = popen("python -c 'import code; import os; import sys; sys.stdout = sys.stderr = open(os.devnull, \"w\"); code.InteractiveConsole().interact()'", "w");
		if (p == NULL) return false;
		send_command("import matplotlib.pyplot as plt");
		send_command("import matplotlib.patches as patches");
		send_command("fig, ax = plt.subplots()");
		send_command("plt.show(block=False)");
		return true;
	}

	bool close() {
		send_command("plt.close()");
		send_command("quit()");
		if (pclose(p) == -1) return false;
		return true;
	}

	void screen(double x1, double y1, double x2, double y2, bool EqualAspect = false) const {
		if (EqualAspect == true) {
			fprintf(p, "ax.set_aspect('equal')\n");
		}
		fprintf(p, "plt.xlim([%.17f,%.17f])\n", x1, x2);
		fprintf(p, "plt.ylim([%.17f,%.17f])\n", y1, y2);
		fprintf(p, "plt.draw()\n");
		fflush(p);
	}

	void line(double x1, double y1, double x2, double y2, const char *color = "blue", const char *opt = "") const {
		fprintf(p, "ax.draw_artist(ax.plot([%.17f,%.17f],[%.17f,%.17f], color='%s', %s)[0])\n", x1, x2, y1, y2, color, opt);
		fprintf(p, "fig.canvas.blit(ax.bbox)\n");
		fprintf(p, "fig.canvas.flush_events()\n");
		fflush(p);
	}

	void point(double x, double y, const char *color = "blue", const char *opt = "") const {
		fprintf(p, "ax.draw_artist(ax.scatter([%.17f],[%.17f], color='%s', %s))\n", x, y, color, opt);
		fprintf(p, "fig.canvas.blit(ax.bbox)\n");
		fprintf(p, "fig.canvas.flush_events()\n");
		fflush(p);
	}

	void rect(double x1, double y1, double x2, double y2, const char *edgecolor = "blue", const char *facecolor = NULL, const char *opt = "") const {

		if (facecolor == NULL) {
			fprintf(p, "ax.draw_artist(ax.add_patch(patches.Rectangle(xy=(%.17f,%.17f), width=%.17f, height=%.17f, fill=False, edgecolor='%s', %s)))\n", x1, y1, x2-x1, y2-y1, edgecolor, opt);
		} else {
			fprintf(p, "ax.draw_artist(ax.add_patch(patches.Rectangle(xy=(%.17f,%.17f), width=%.17f, height=%.17f, fill=True, edgecolor='%s', facecolor='%s', %s)))\n", x1, y1, x2-x1, y2-y1, edgecolor, facecolor, opt);
		}
		fprintf(p, "fig.canvas.blit(ax.bbox)\n");
		fprintf(p, "fig.canvas.flush_events()\n");
		fflush(p);
	}

	void ellipse(double cx, double cy, double rx, double ry, const char *edgecolor = "blue", const char *facecolor = NULL, const char *opt = "") const {
		if (facecolor == NULL) {
			fprintf(p, "ax.draw_artist(ax.add_patch(patches.Ellipse(xy=(%.17f,%.17f), width=%.17f, height=%.17f, fill=False, edgecolor='%s', %s)))\n", cx, cy, rx*2, ry*2, edgecolor, opt);
		} else {
			fprintf(p, "ax.draw_artist(ax.add_patch(patches.Ellipse(xy=(%.17f,%.17f), width=%.17f, height=%.17f, fill=true, edgecolor='%s', facecolor='%s', %s)))\n", cx, cy, rx*2, ry*2, edgecolor, facecolor, opt);
		}
		fprintf(p, "fig.canvas.blit(ax.bbox)\n");
		fprintf(p, "fig.canvas.flush_events()\n");
		fflush(p);
	}

	void circle(double cx, double cy, double r, const char *edgecolor = "blue", const char *facecolor = NULL, const char *opt = "") const {
		ellipse(cx, cy, r, r, edgecolor, facecolor, opt);
	}

	void polygon(double *x, double *y, int n, const char *edgecolor = "blue", const char *facecolor = NULL, const char *opt = "") const {
		int i;

		fprintf(p, "ax.draw_artist(ax.add_patch(patches.Polygon((");
		for (i=0; i<n; i++) {
			fprintf(p, "(%.17f,%.17f),", x[i], y[i]);
		}

		if (facecolor == NULL) {
			fprintf(p, "), fill=False, edgecolor='%s', %s)))\n", edgecolor, opt);
		} else {
			fprintf(p, "), fill=True, edgecolor='%s', facecolor='%s', %s)))\n", edgecolor, facecolor, opt);
		}
		fprintf(p, "fig.canvas.blit(ax.bbox)\n");
		fprintf(p, "fig.canvas.flush_events()\n");
		fflush(p);
	}

	void save(const char *filename) const {
		fprintf(p, "plt.savefig('%s')\n", filename);
		fflush(p);
	}

	void send_command(const char *s) const {
		fprintf(p, "%s\n", s);
		fflush(p);
	}

	void clear() const {
		send_command("plt.clf()");
	}
};

#endif // MATPLOTLIB_HPP
以下は簡単なテストプログラム(test-matplotlib.cc)。
#include "matplotlib.hpp"

int main()
{
	matplotlib g;

	// initialize
	g.open();

	// set drawing range
	g.screen(0, 0, 10, 10);
	// aspect ratio = 1
	// g.screen(0, 0, 10, 10, true);

	g.line(1,1,3,4);
	g.line(1,2,3,5, "red");

	g.rect(4,6,5,8);
	g.rect(6,6,7,8, "green");
	g.rect(8,6,9,8, "black", "red");

	g.point(4,2);
	g.ellipse(8,2,2,1);
	g.circle(2,8,2);

	double xs[5] = {6., 7., 6., 5., 5.};
	double ys[5] = {4., 5., 6., 6., 5.};
	g.polygon(xs, ys, 5, "black", "yellow");

	g.line(1,3,3,6, "green", "alpha=0.2");
	g.line(1,4,4,5, "black", "alpha=0.5, linestyle='--'");
	g.point(4, 3, "red", "s=100");

	g.save("test.pdf");

	getchar();

	// finish drawing
	g.close();
}
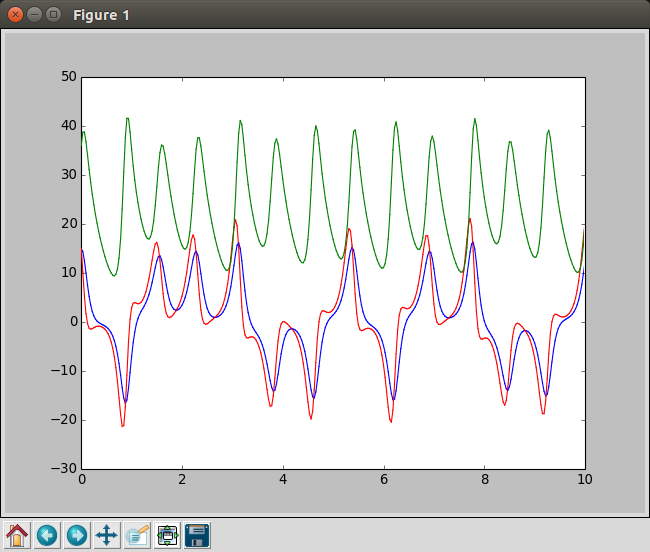
普通にコンパイルして走らせると、matplotlibが使えるpythonがインストールされていれば、

のように表示されます。非常に短いプログラムなのでソースを見るのが早いような気もしますが、以下、簡単に使い方を説明します。


